Projects
Machine Learning
A collection of projects where I explore real-world problems through data, machine learning, and practical experimentation. Each one reflects my interest in turning raw data into insight and building models that actually make sense outside of a textbook.
Flight Delay Predictor

XGBoost · Time-Based Validation · Cost-Aware Decision Support · Operations Analytics
This project develops a flight delay risk model using operational and historical flight data, with a focus on how machine learning predictions should be used in real airline operations. An XGBoost model was trained and validated using time-based splits, achieving strong ranking performance (ROC-AUC ≈ 0.93).
Beyond standard model evaluation, the project explored threshold tuning, alert volume tradeoffs, and cost-based utility analysis to assess whether automated operational interventions would create value. Under realistic cost assumptions, automated alerts were found to add limited operational benefit despite strong predictive accuracy.
As a result, the final system is designed as a decision-support tool that ranks flights by delay risk, enabling operations teams to prioritize attention and monitoring rather than triggering rigid automated actions. The project highlights the importance of aligning machine learning systems with operational constraints and real-world decision costs.
NBA Player Valuation Using Machine Learning

Machine Learning · Salary Prediction · Roster Optimization · Sports Analytics
This project develops a machine learning–driven player valuation model using historical NBA performance data and contract information, with a focus on how analytics can be used to improve roster construction and contract decision-making. Multiple models were trained and optimized to predict player salaries based on on-court performance, advanced statistics, and role-specific indicators, achieving strong predictive accuracy across seasons.
Beyond standard model evaluation, the project explored feature engineering, salary cap normalization, and performance archetype segmentation to understand how different player profiles are valued across the league. Cluster analysis was used to identify high-impact, low-cost player types and highlight inefficiencies in contract allocation, particularly among role players and high-variance contributors.
As a result, the final system is designed as a decision-support tool that highlights undervalued talent and potential overpayments, enabling teams to prioritize smarter spending, reduce contract risk, and improve long-term roster efficiency. The project demonstrates how machine learning can be applied to real-world strategic decisions in high-stakes, salary-constrained environments.
Operations Research & Business Strategy
I apply optimization, probabilistic modelling, and financial analysis to real-world business problems. These projects go beyond building models. They connect analytical outputs directly to strategic decisions, translating complex quantitative findings into clear, actionable recommendations for stakeholders.
Uganda Airlines: Fleet Fragility and Operational Optimization

Network Analysis · Monte Carlo Simulation · MILP · NPV Analysis · Operations Analytics · Pyomo · Gurobi
This project applies a four-part data science and operations research framework to quantify the financial cost of fleet fragility at Uganda Airlines and identify the optimal capital investment to address it. All data is publicly sourced, and the study was conducted while two of the airline's seven aircraft were actively grounded.
Part 1 establishes that the A330-800neo generates 55.2% of estimated revenue from only 14.3% of departures. With one A330 grounded, daily block-hour demand reaches 21.6 hours against an industry ceiling of 16 — a physical impossibility.
Part 2 fits a Weibull distribution to observed grounding events and runs a 10,000-year Monte Carlo simulation. The expected annual disruption cost is $75.8M — exceeding the airline's reported annual loss of $76.3M.
Part 3 solves a MILP scheduling model (Pyomo + Gurobi) proving that removing any single active aircraft makes the schedule mathematically infeasible. Uganda Airlines operates with zero schedule redundancy.
Part 4 evaluates eight fleet investment options using NPV and stochastic optimization. The recommended intervention produces an expected NPV of $252M at $15M capex, with a payback period of approximately three months.
Business Process Transformation & Process Reengineering In Rural Uganda
Digital Transformation · Process Reengineering · Operational Strategy · AI Enablement
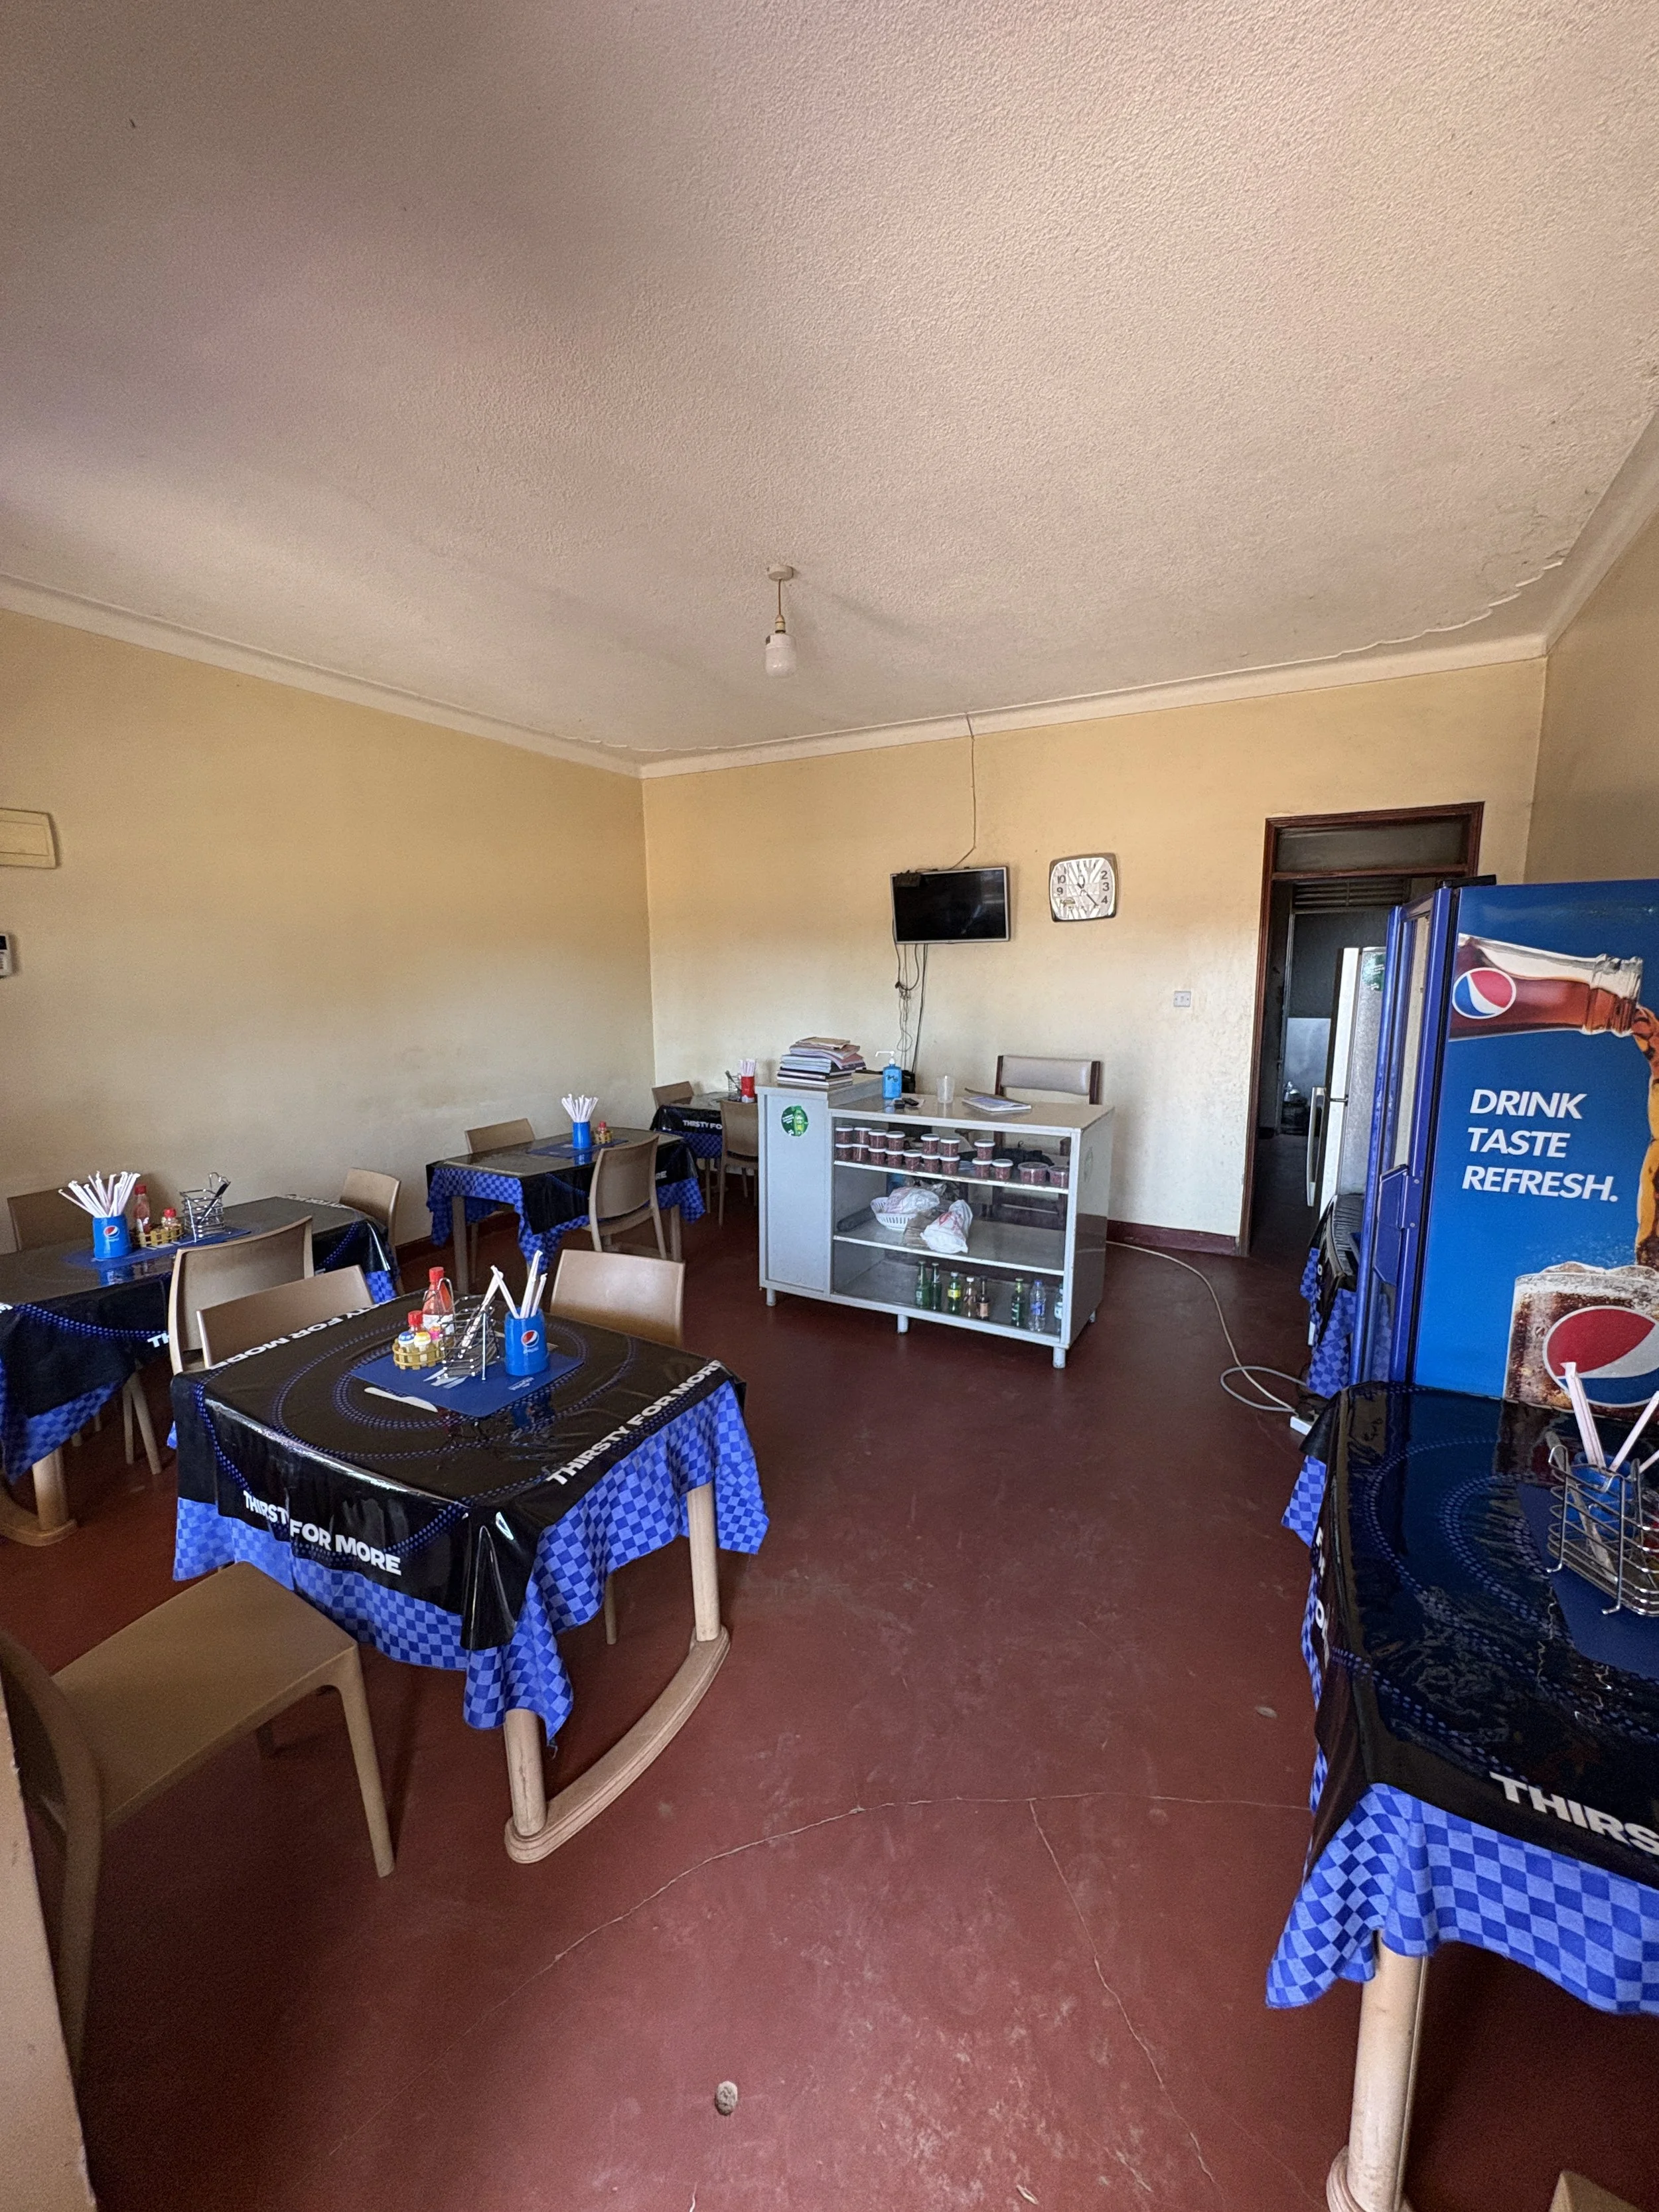
This project delivered a comprehensive business process transformation strategy for a growing restaurant and catering organization, focused on modernizing manual operations through digital enablement, process automation, and AI-supported systems. The initiative evaluated core operational workflows, payment processing, inventory management, and data handling practices to design a scalable, secure, and analytics-ready operating model.
A detailed as-is / to-be process analysis was conducted using BPMN workflow modeling and entity relationship design to identify inefficiencies, control gaps, and opportunities for automation. Multiple POS and digital platforms were assessed using a structured decision framework, incorporating usability, feature depth, cost, security, and fraud prevention capabilities. The recommended solution architecture was designed to support real-time transaction tracking, inventory analytics, customer data management, and operational reporting.
Beyond system selection, the project developed a full implementation roadmap, including technical integration steps, staff training programs, change management planning, and enterprise risk mitigation strategies. Ethical considerations, data privacy safeguards, and sustainability impacts were incorporated to ensure responsible technology adoption.
As a result, the final solution framework is positioned as an operational decision-support platform that enables improved financial control, reduced fraud risk, faster transaction processing, and data-driven management decisions. The project demonstrates how structured digital transformation and process engineering can be applied to real-world business environments to improve efficiency, transparency, and long-term scalability.
Data Visualization
I design data visualizations that translate complex datasets into structured insights. These projects focus on exploratory analysis, segmentation, and visual storytelling using tools like R and Python to uncover patterns that inform real-world decision-making.
Premier League Player Performance
RStudio · Tidyverse · Data Visualization · Sports Analytics
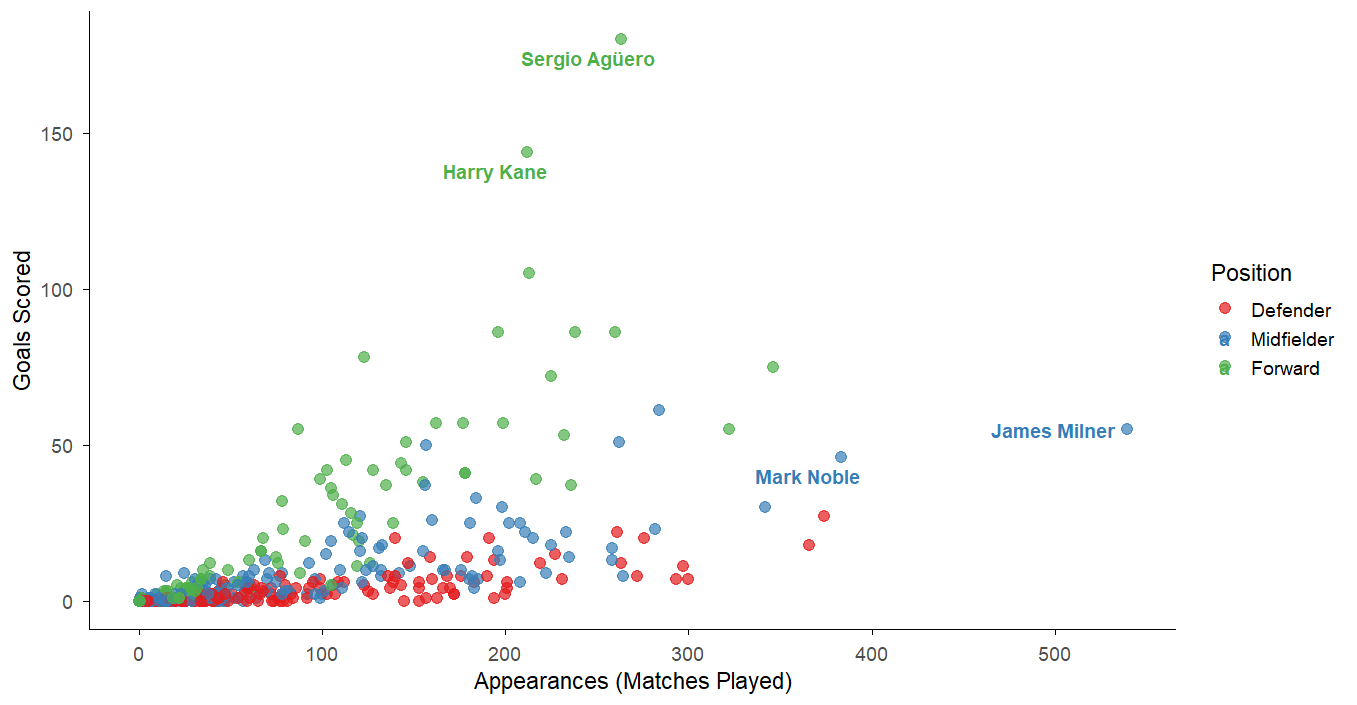
This project explores performance patterns among Premier League players using position-based segmentation and visual analytics. Using R and the Tidyverse, I analyzed historical player statistics to examine how appearances, goal output, and team goal distribution vary across defenders, midfielders, and forwards.
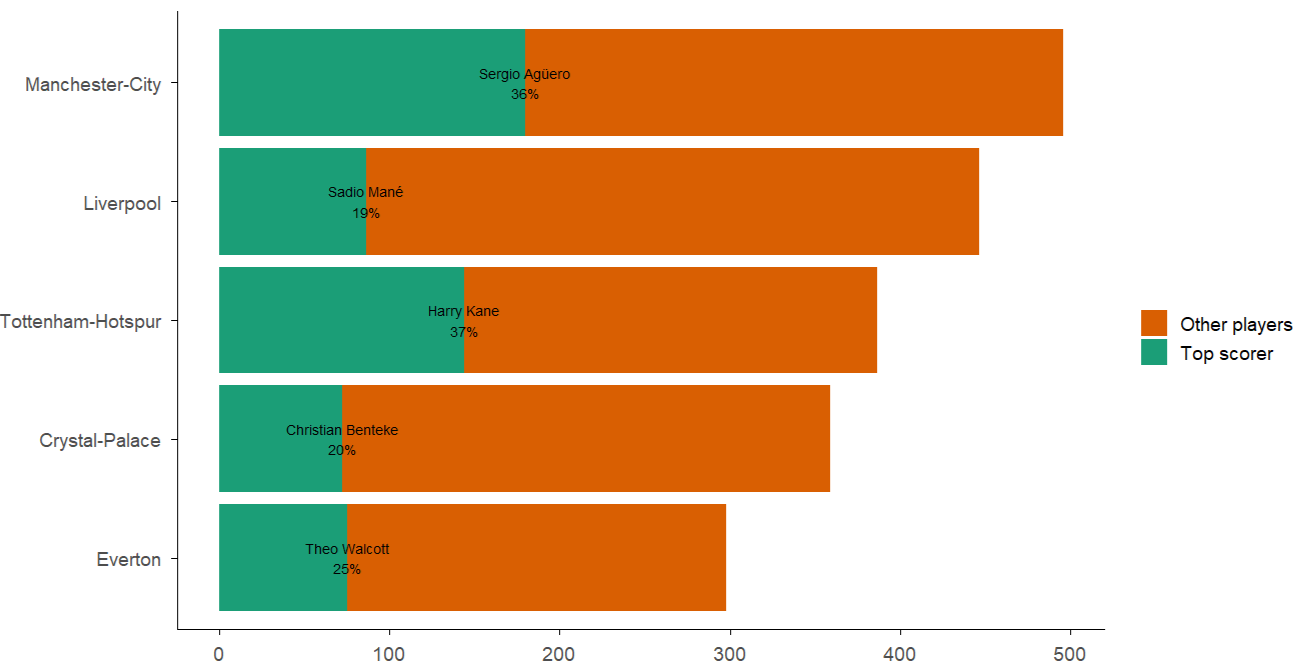
A scatterplot analysis highlights structural differences in scoring productivity by position, while annotated player outliers (e.g., high-efficiency forwards and long-tenured midfielders) provide context around performance extremes. A complementary stacked bar visualization evaluates club-level goal contribution, comparing top scorers against overall team production to assess dependency concentration.
The project demonstrates how data visualization can uncover role-based performance dynamics and team scoring structures, offering insights relevant to scouting, roster construction, and performance evaluation.
Texas Housing Market Analysis
RStudio · Tidyverse · Data Visualization · Exploratory Data Analysis
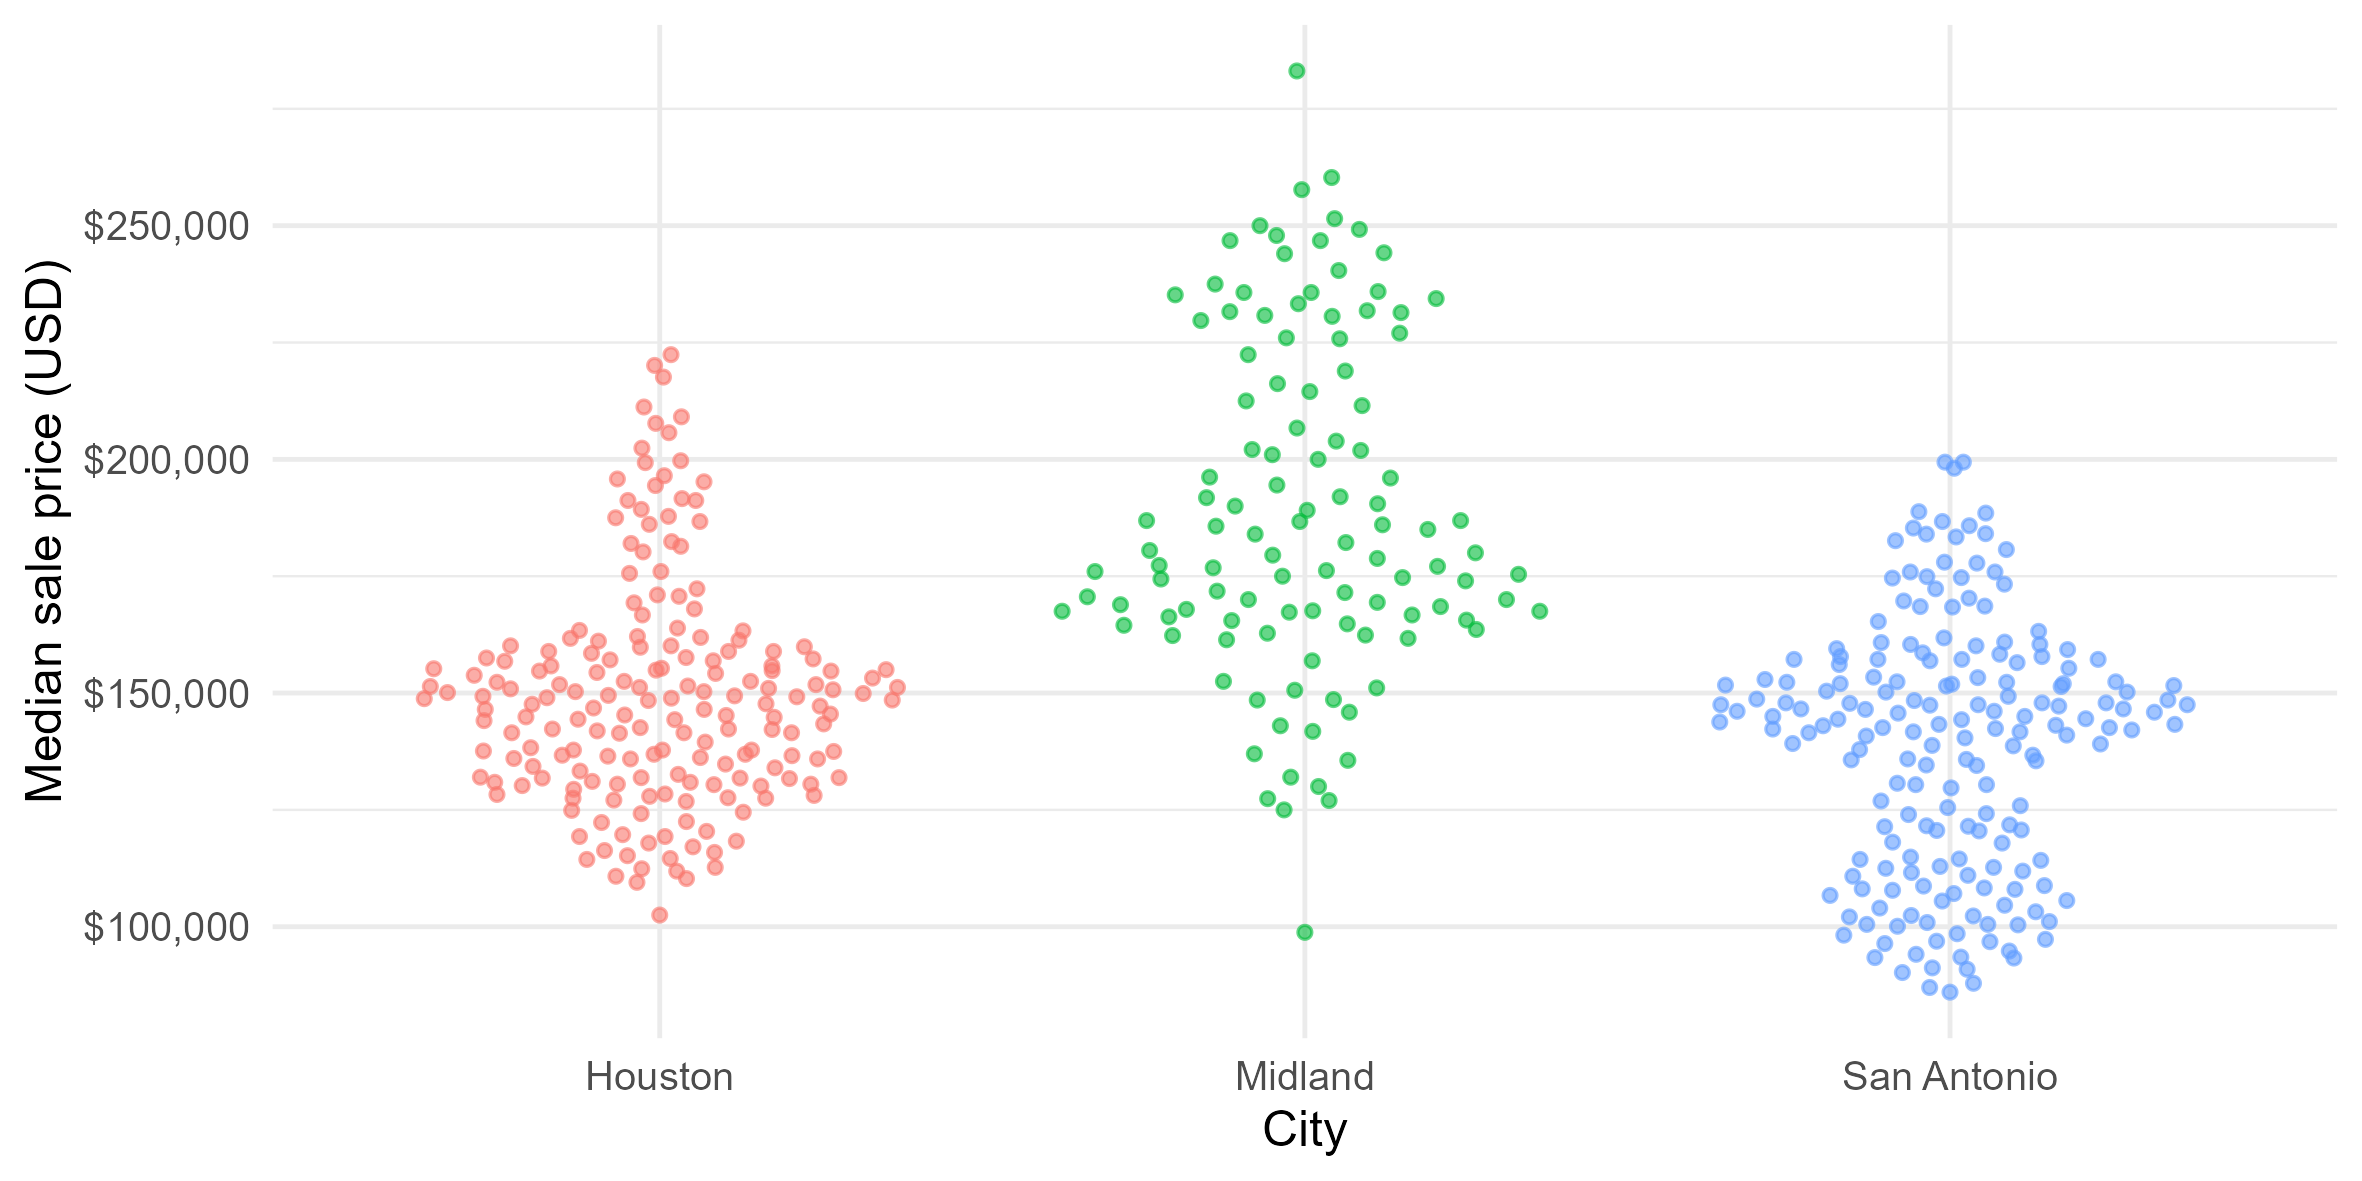
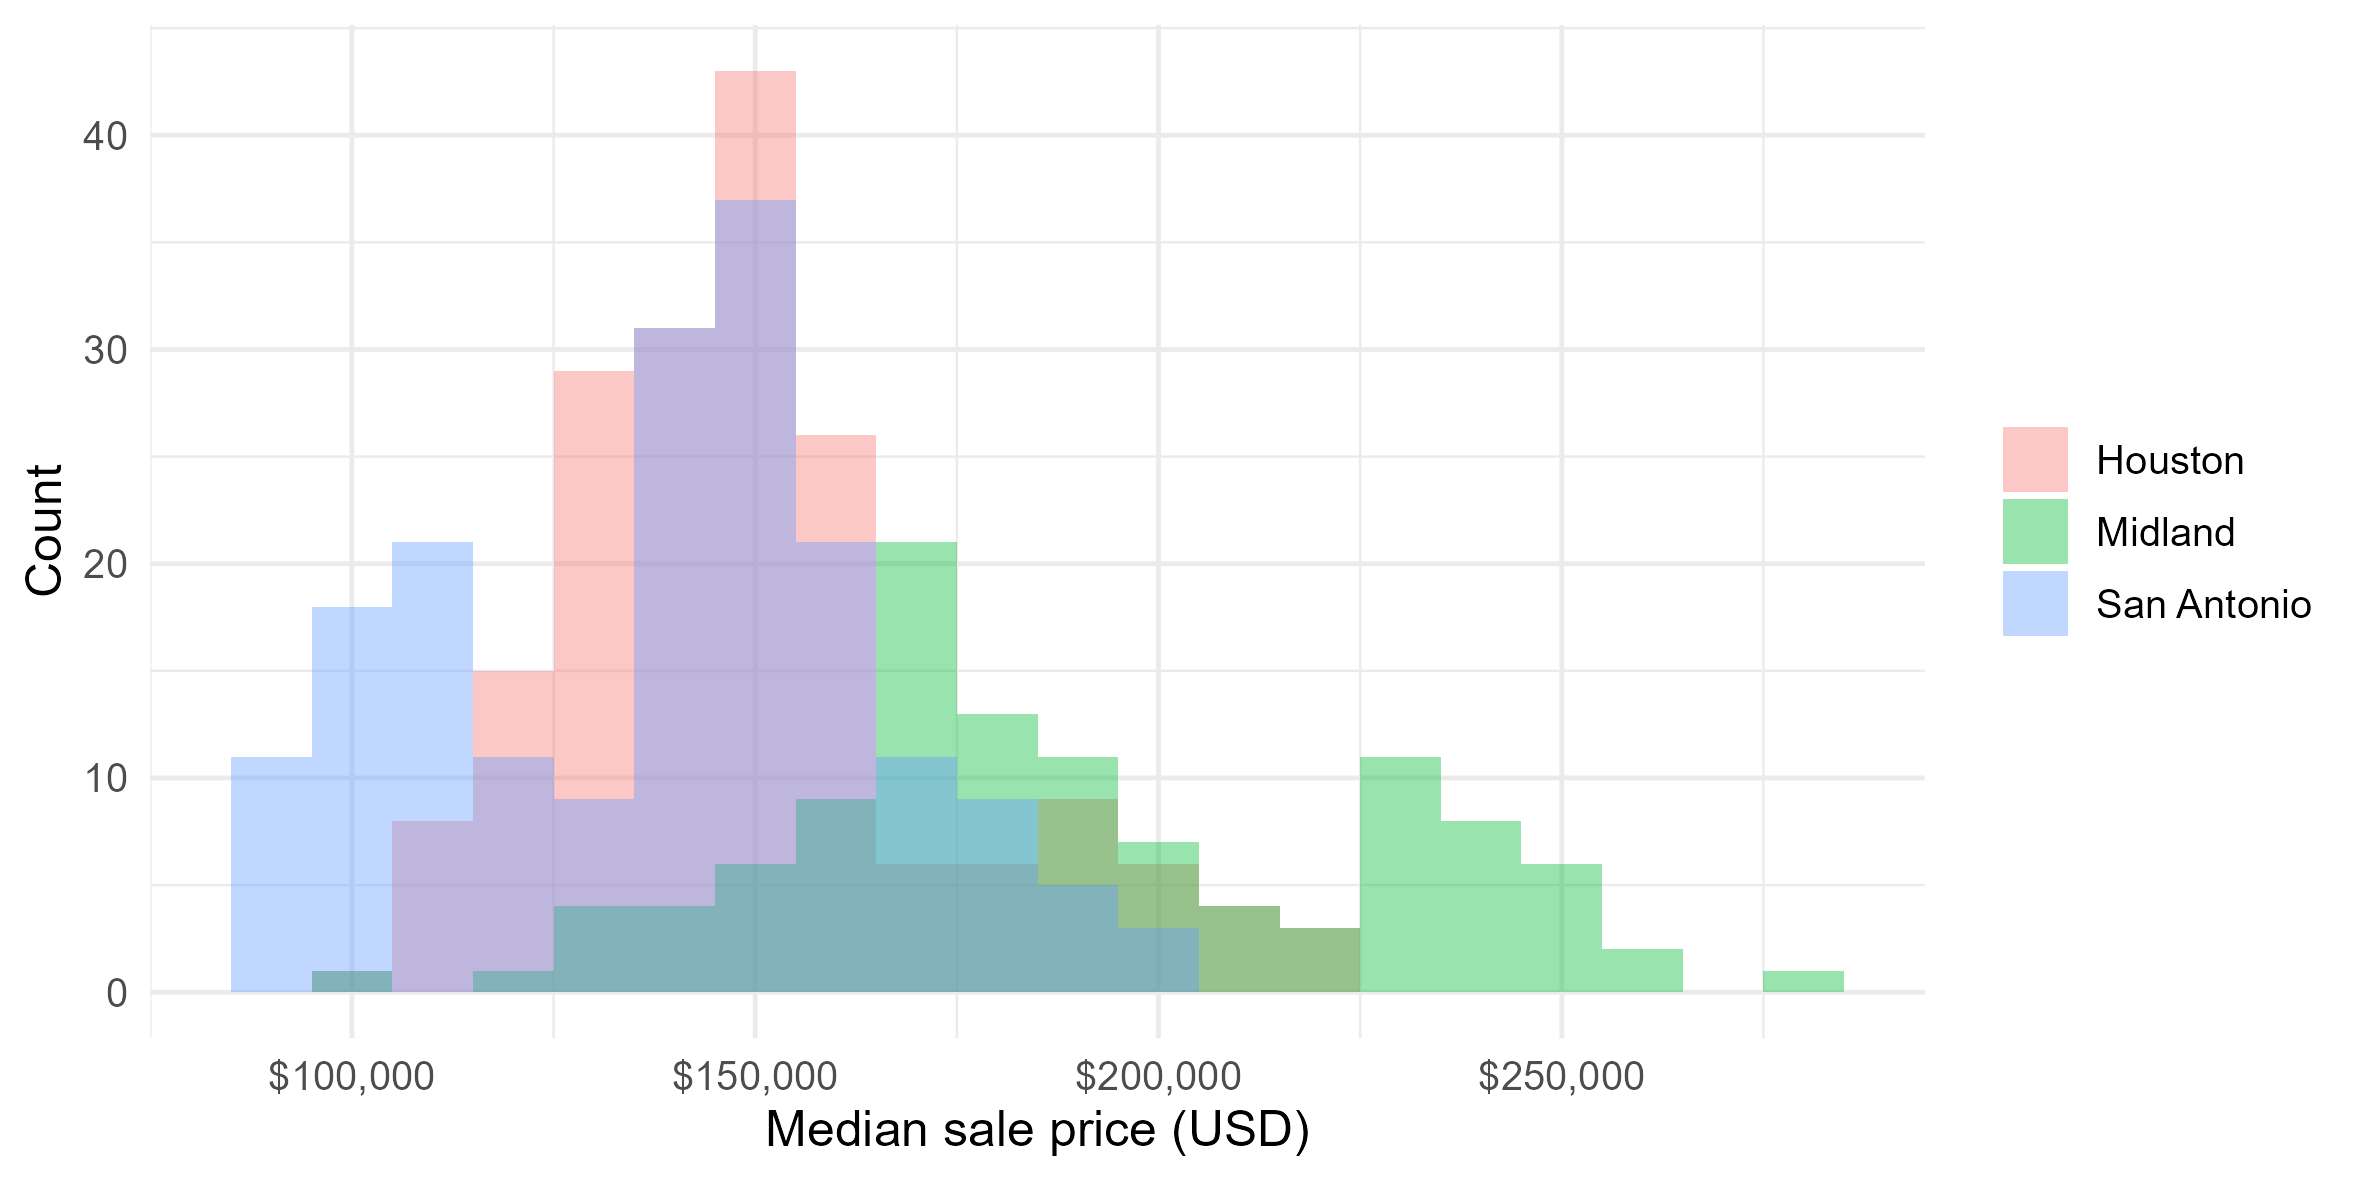
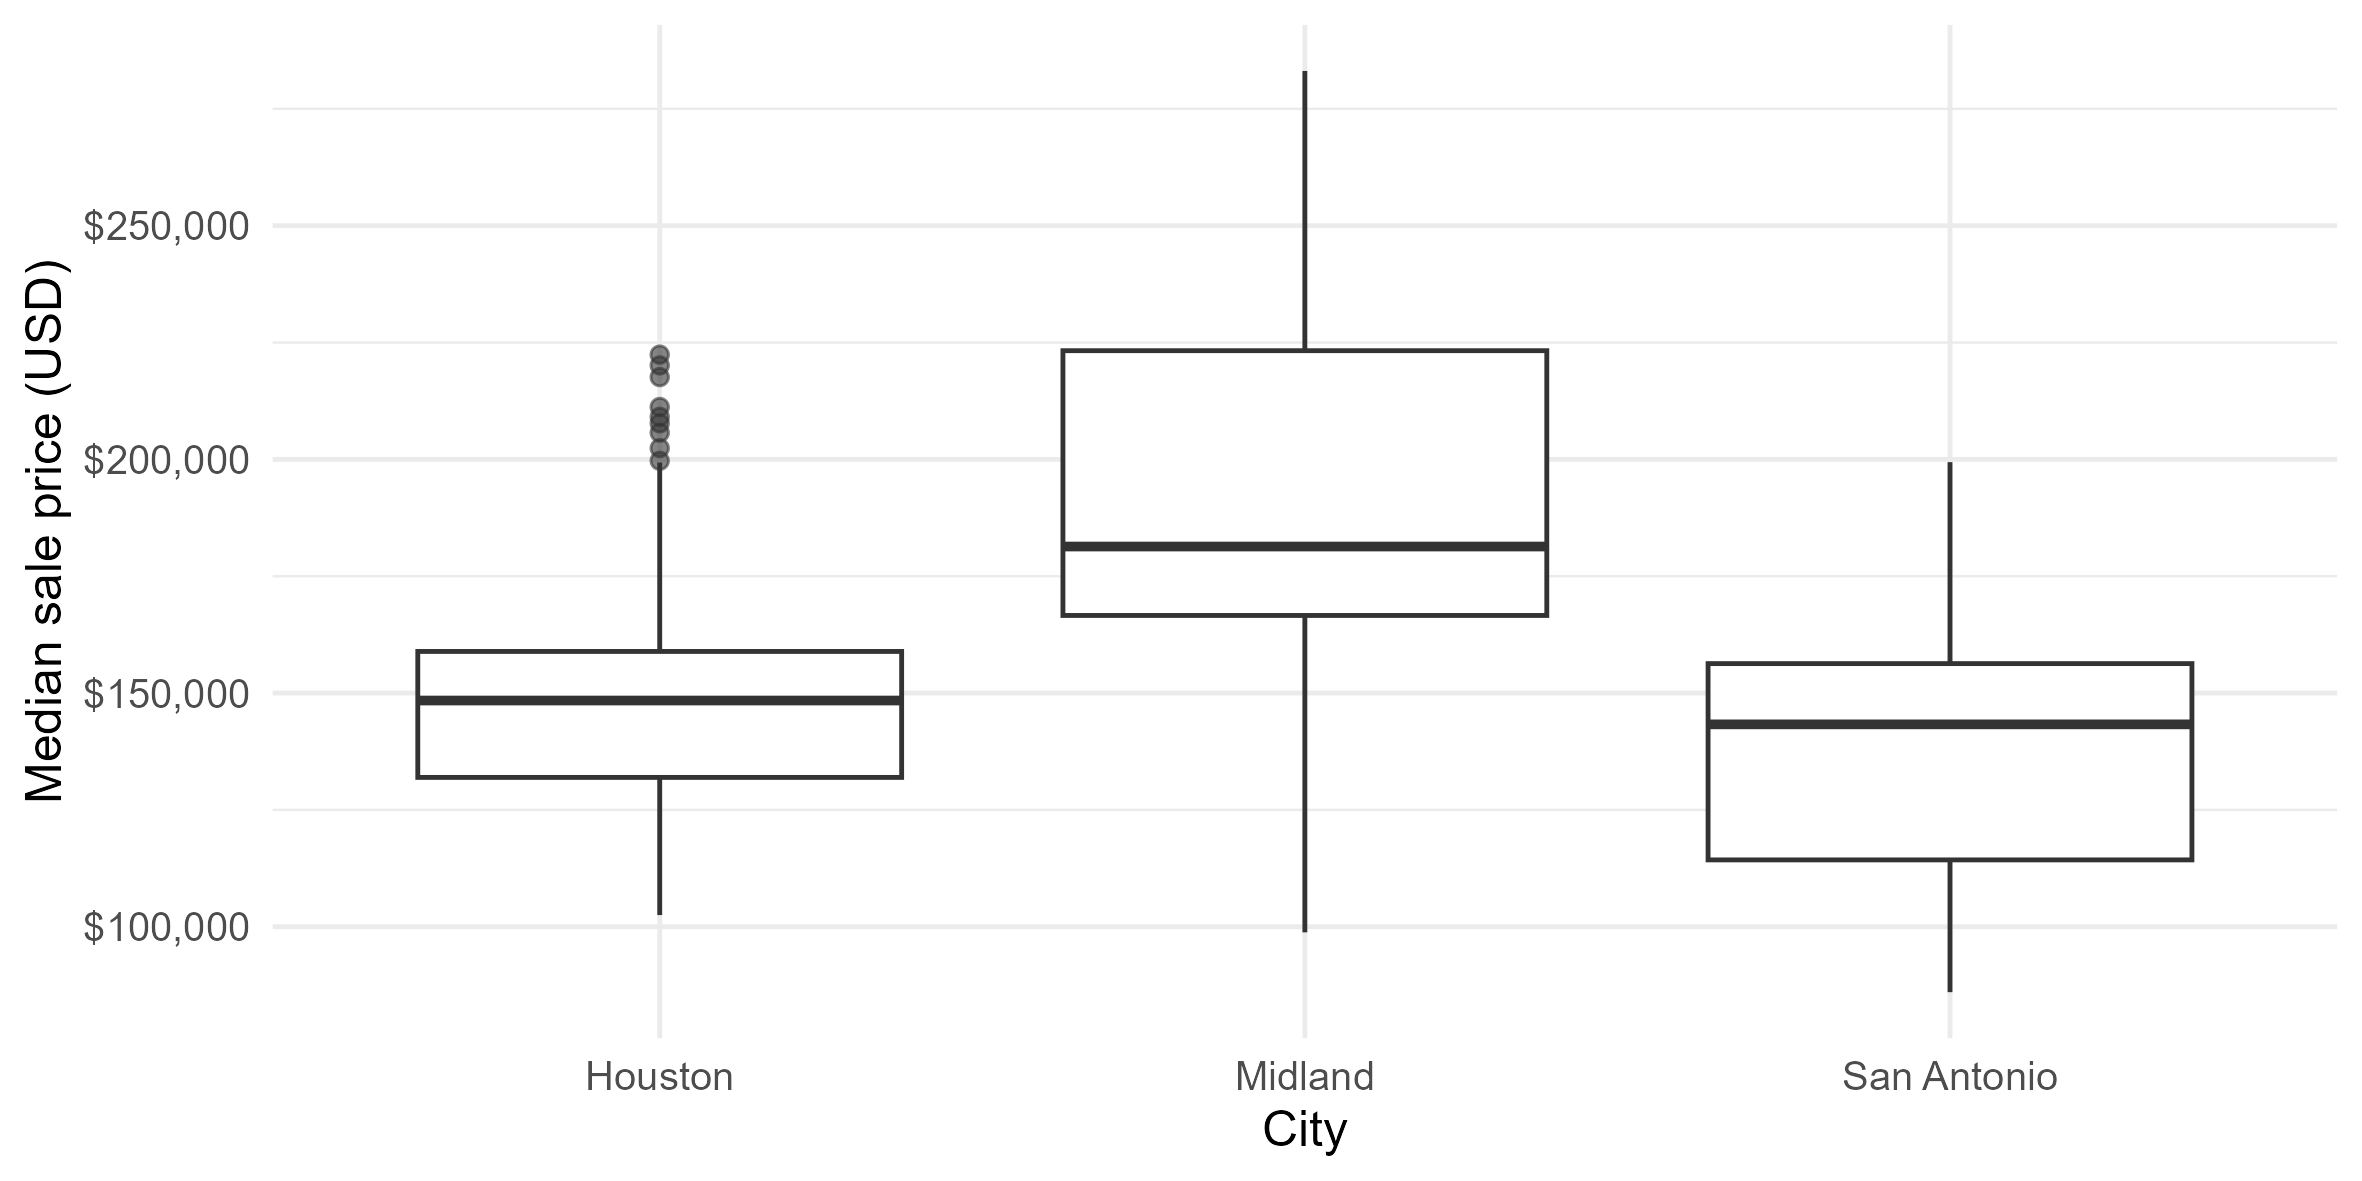
This project explores housing price dynamics across major Texas cities using comparative distribution analysis and visual segmentation. Using R and the Tidyverse ecosystem, I analyzed median sale prices across Houston, Midland, and San Antonio to identify structural differences in pricing levels, dispersion, and outlier behavior.
The dataset was cleaned and standardized to enable consistent cross-city comparison, with emphasis placed on distributional analysis rather than simple averages. Instead of focusing solely on mean pricing, the project evaluates full distribution shapes to examine skewness, spread, and upper-tail concentration within each regional market.
Multiple visualization techniques — including jitter plots, overlaid histograms, and boxplots — were used to compare central tendency, variability, and volatility patterns. These layered visual diagnostics reveal meaningful regional differences in price dispersion and market concentration, offering insight into relative housing affordability and stability.
Overall, the project demonstrates how structured exploratory data analysis and intentional visualization design can uncover geographic pricing disparities and support more informed real estate market assessment.